Benny Audio writes: “ In the previous article, I discussed the challenges of objectively and standardized measuring the quality of turntable drives using tools based on test vinyl records. Now, it is time to examine contemporary tools, both for everyday users and professionals.

Let’s start with tools for civilians. It turns out that we have excellent devices equipped with gyroscopes right at our fingertips—modern mobile phones. Several applications have been developed for these devices that can successfully test our turntable drives.
How does it work? Simply place the phone on the platter (preferably on a flat record clamp), start the drive at 33.3 RPM, and wait a moment. The application will then check the performance and provide results in the form of numbers and graphs. Importantly, this data is not related to the sound—only and exclusively to the drive.
However, it’s not without its flaws.
- different applications calculate Wow and Flutter (W&F) in different ways.
- phones have different internal components, so to obtain comparable results, you would need to use the same phone and application.
- phones struggle to accurately show the average speed (which should be exactly 33.33 and 45.11 RPM). For this aspect, you need to either use a professional device (more on this later), a stroboscope disc, or a test record (yes, I know I just criticized them). By using a record, we can capture the “average” speed and determine if the platter spins too fast or too slow, despite signal fluctuations.
A small digression here—test records are pointless for measuring W&F, but they are absolutely useful for other tests and experiments 😊 Do not get rid of them!
What do applications measure?
- The average speed value (usually the largest number on the screen): This is the one phones struggle with, as I mentioned earlier.
- WOW or WOW & Flutter: These indicate the variations in speed.
- A graph with a zoom option: This shows how the speed changes over time.
My favourite apps.
IOS:

This is definitely the best application on the market because it is the only one that measures both WOW and Flutter. Additionally, it has a database and operates on a single hardware, system, and software platform, making it a dream come true. The only variable would be the version of the device (in this case, iPhone).
Android:
It measures only WOW, so the values appear better than on iOS (seemingly better). It does not have a database. In my opinion, it shows the average speed better (but that might be a matter of the specific device).
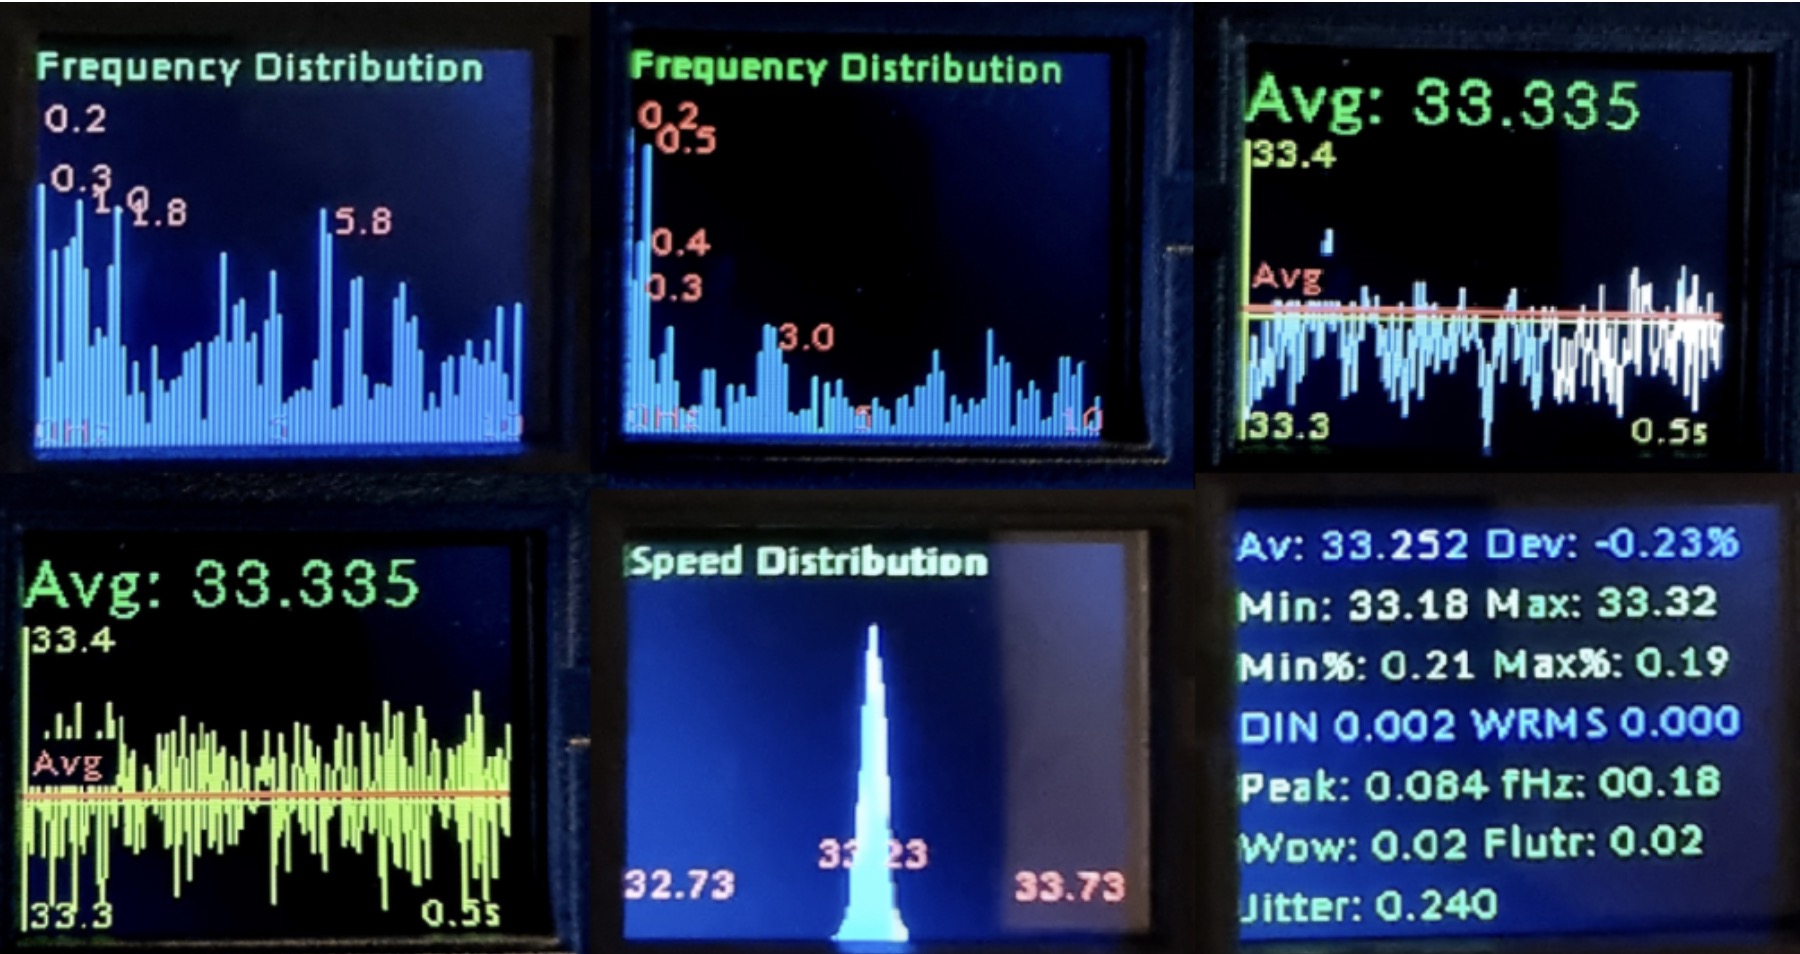
What do the applications display in the results:
- The large number (in red circle) is the average speed.
- The small number (in yellow circle) is WOW or W&F.
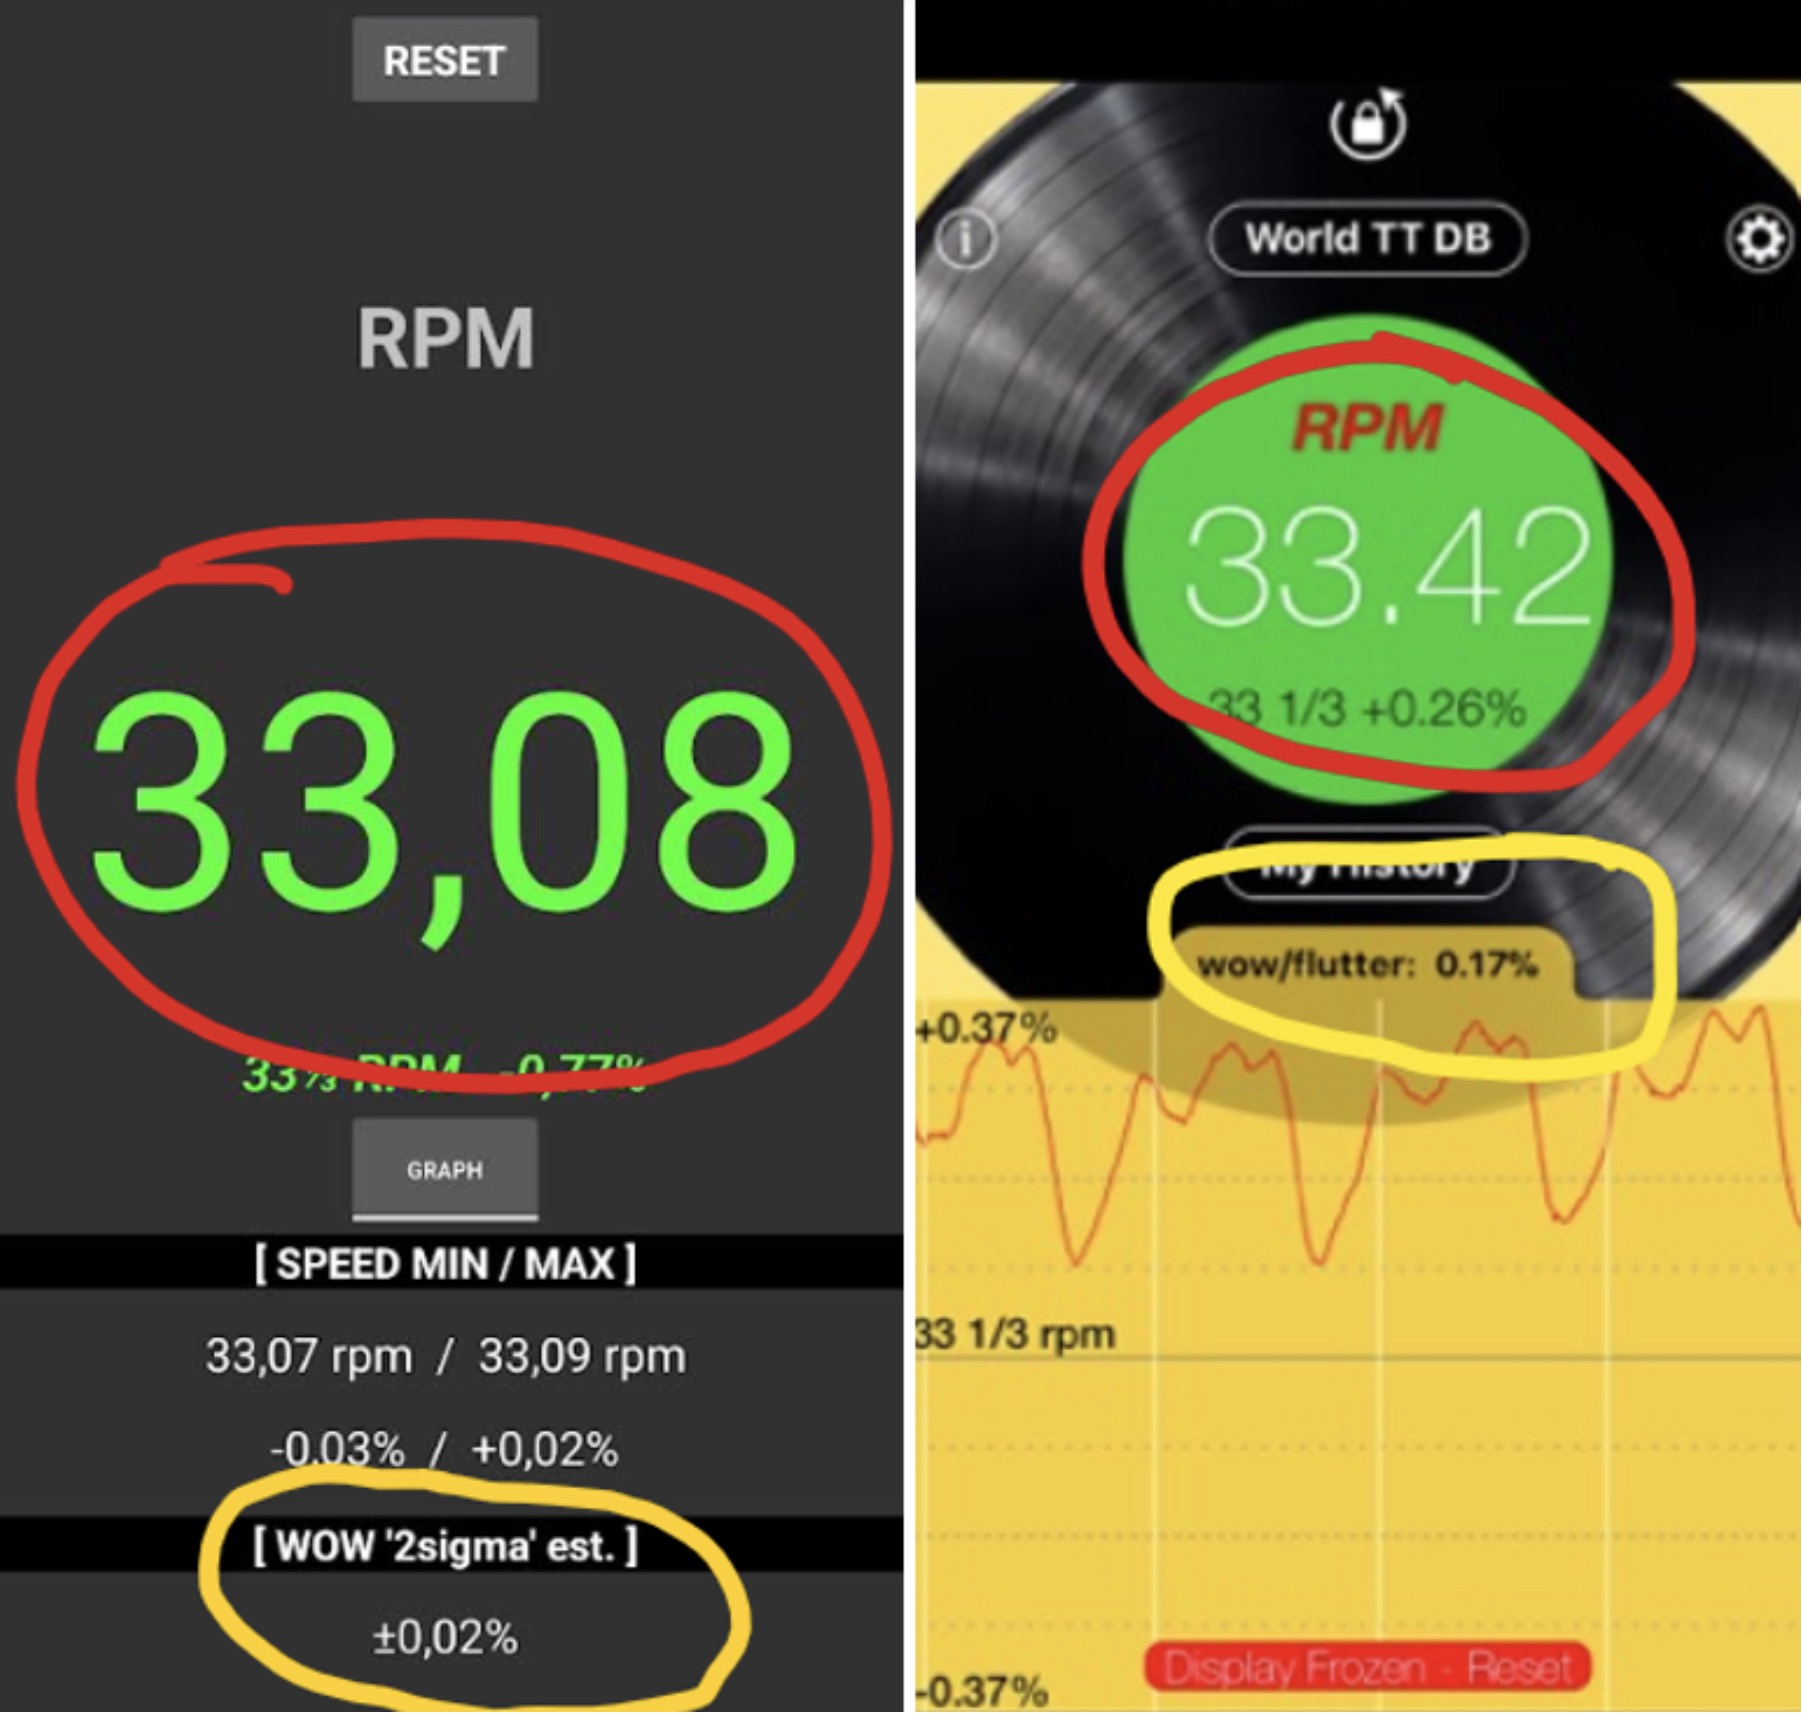
The average speed is clear – it should be spot on. Sometimes on Facebook, photos from calibration sessions of different equipment appear – a picture of a computer screen with the needle in the green zone😊 with a caption claiming it is perfect. It’s like capturing a bird in flight and claiming it levitates😊. The needle might just as well be swinging left and right, but a well-timed snapshot gives the illusion of perfection.
That’s why W&F is more important and tells us more about the drive’s quality. W&F is measured over time, and the resulting number clearly indicates the quality. The lower the W&F, the better.
The threshold on Android is 0.02%, while on iOS, it is 0.05%.
The apps also display graphs. On iOS (screen on the right above), the graph flattens as the average speed deviates from 33.3 RPM.
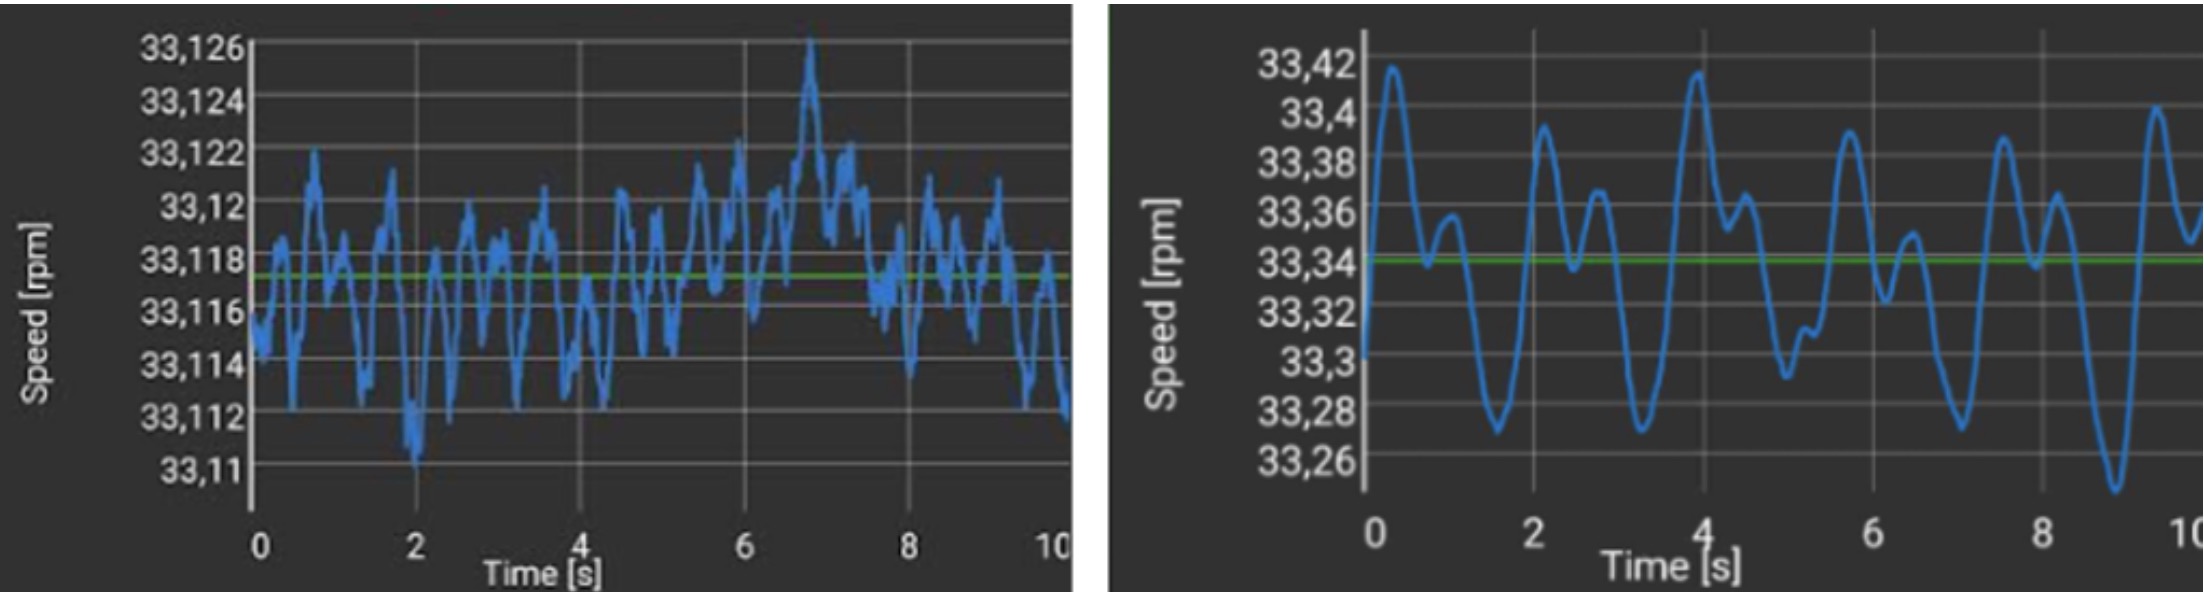
In contrast, on Android, the graph scales (check screen below), which might give the impression that the results are not very promising. However, if you look at the scale on the left, everything becomes clear.
An example of an extremely good drive is shown on the left, and a “so-so” one on the right. On the right, you can probably hear Keith Jarrett playing on a Hammond organ instead of a piano at the Koln concert😊. This is also an example of a 440 Hz tone fluctuating between 441 and 439 Hz with each turn of the platter (as I mentioned earlier).
Since the app on iOS has a database, it’s worth taking a look because it’s an interesting read. As of today (June 23, 2024), there are already almost 12000 entries. The entries can be sorted either by average speed or by W&F. Using the latter reveals the crème de la crème.
The best result is 0.05%. This hasn’t changed for a long time.
- GARRARD
- EMT 927F
- Technics SL-1000 MKII
- AMG VIELLA V12 (the only belt-drive in the lineup with a top result and my absolute idol!)
We can see the dominance of direct-drive turntables. It is also evident how vintage turntables have outperformed contemporary “high-end” models. After 40 years, nothing surpasses them, and only one can match. Respect to the engineers at AMG!
What do we have next with belt-drives (they make up about 10-12% of the top 50, the rest are vintage DDs)?
- 0.06% – AMG and the vintage Micro Seiki
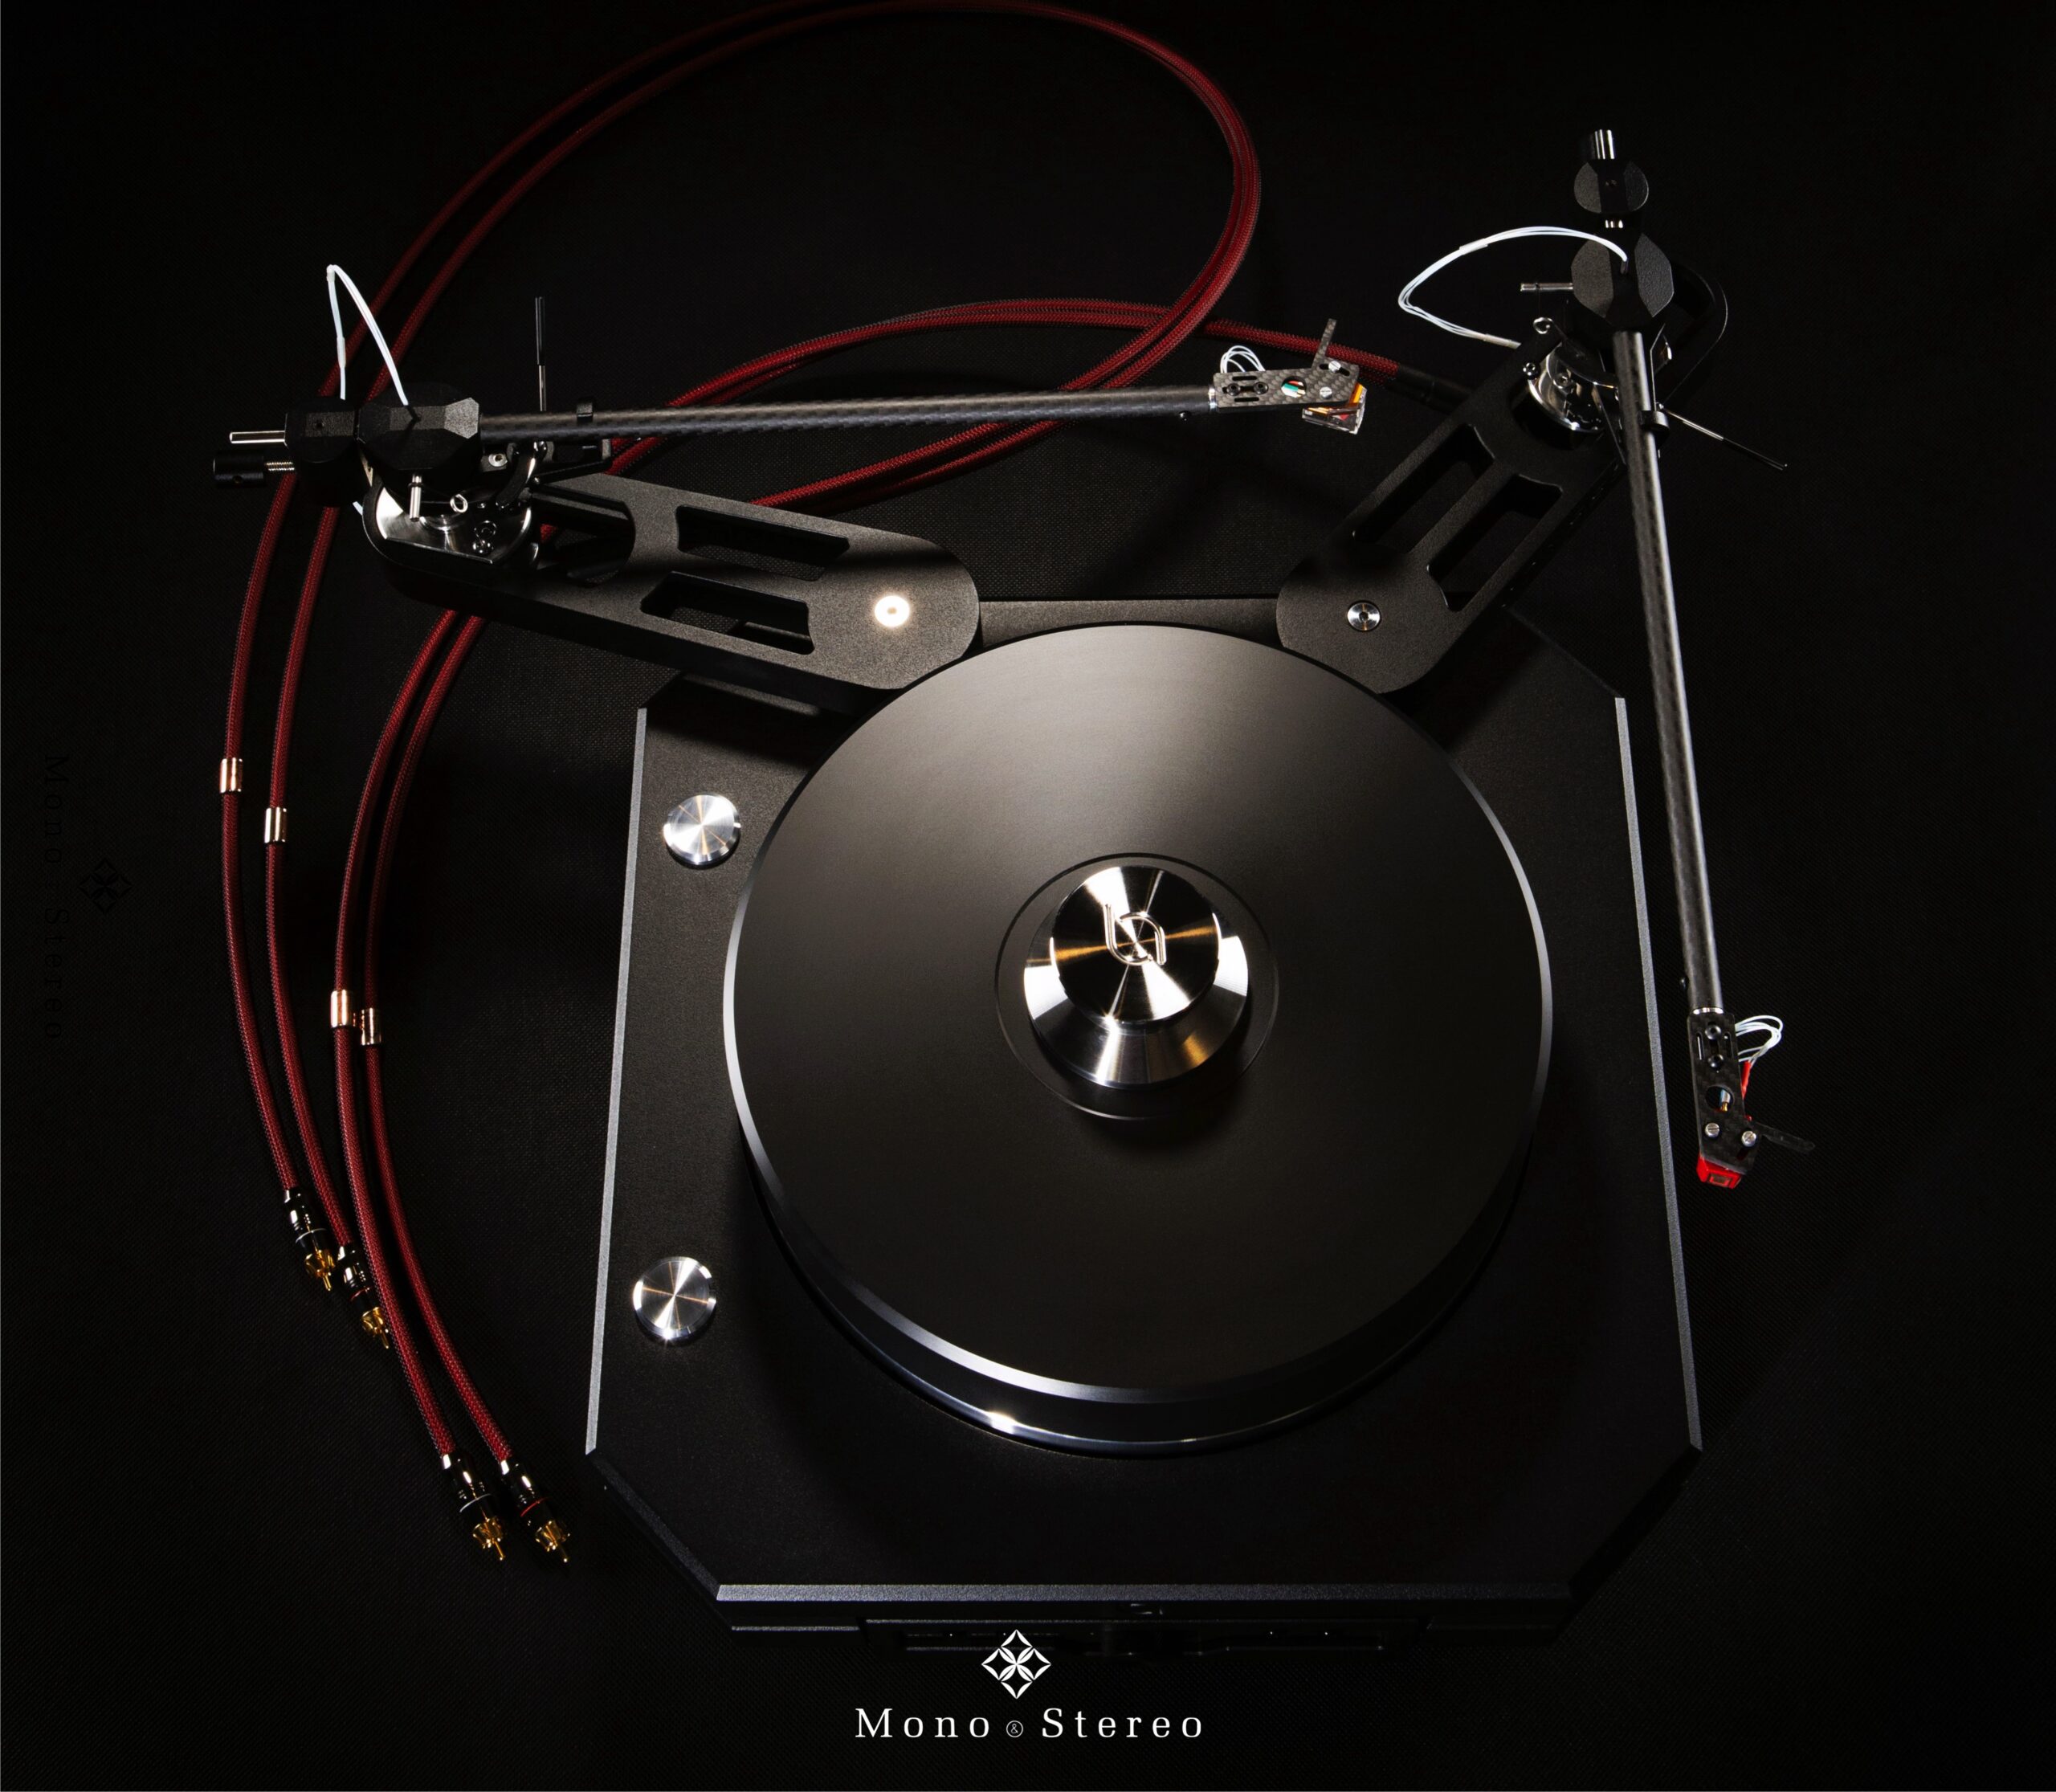
- 0.07% – here, alongside just a few contemporary belt-drives, we have BennyAudio Odyssey!
- 0.08% – there are more belt-drives here, among them – BennyAudio Immersion.
There are no random measurements in this list. I assume that these are the best (like the best lap in a race) single entries, presumably recorded by the manufacturers themselves. BennyAudio Odyssey is at the absolute top! And as I will show later – also in measurements on professional equipment.
Someone might question the measurements on mobile devices due to different applications, various components, and different device versions. This is true. Nevertheless, among widely accessible devices that do not require specialized knowledge, these are the best possible measurement tools.
But what if we want to check the drive with a professional tool?
This is where SHAKNSPIN, now available in version MK2, comes to the rescue. It’s a fantastic device that measures much more than just average speed or WOW & Flutter.
First, some details:
- During measurement, the device should be placed on the platter in an obvious way, centered around the spindle.
- It is lightweight, so there’s no issue with delicate platters and bearings.
- It is balanced.
- It has a color display.
- It is controlled using movements (gyroscope).
- Additionally, it has a reflective tape element for calibration purposes.
SHAKNSPIN is used by reviewers and increasingly by manufacturers who take turntables seriously. This is very good news! Maybe someday we will be able to compare apples to apples!
The device operates similarly to phone applications – just start the measurement, place it on the platter, and wait for the result. The result can be sent to any email address in CSV format via Bluetooth connection with a phone (using a dedicated, easy-to-use application). This way, the result is also delivered to the manufacturer, who includes it in the database of devices.
What does SHAKNSPIN measure (copied from the manufacturers website):
- Average speed in RPM.
- Deviation: Percent deviation of the average vs the correct speed (33.33 or 45).
- Variation: Maximum and minimum speed observed.
- Min%, Max%: Maximum and minimum speed observed as percentage of the average speed.
- High-pass filtered min / max speed variation: Minimum and maximum speeds observed, having removed the slow speed variations (Wow), if detected.
- W&F (no weighting)
- W&F Din: W&F weighted by the IEC / DIN 60386 weighting curve.
- W&F 2-sigma: The 2-sigma means that the lowest 2.5% and highest 2.5% of the speeds observed (the outliers) are discarded for the W&F calculation.
- W&F WRMS: Weighted (IEC / DIN 60386 curve) RMS of the Wow & Flutter values observed.
- Wow: Same as W&F peak-to-peak but weighted by a bandpass filter centered on 2Hz.
- Flutter: Same as W&F peak-to-peak but weighted by a bandpass filter centered on 50Hz.
- Jitter: Average of the total speed variations per second, as a percentage of the average speed.
- Modulation Frequency (primary): If different from zero, represents the periodicity (in Hz) of the low frequency (wow) strongest modulation found (strongest as in more evident) in the signal. A value of zero means the modulation was too insignificant in amplitude, or irregular in period, to be considered.
- Modulation Frequency (secondary): Same as above, but next in correlation power (less evident)
I recommend visiting the manufacturer’s website and delving into the detailed explanations of each parameter in the DOWNLOAD section.
Here, you can also find a database with results, including the BennyAudio Odyssey. This turntable boasts one of the best results in the database (at worst, the second-best). While there are not many records yet, these top values will be hard to beat!
I believe that’s everything I wanted to share as a turntable manufacturer about measurement tools. It would be ideal if everyone used the same measurement solution to clearly determine the quality of the drive, not only through the lens of the technologies and embellishments used but primarily through the lens of results and quality—because that’s what matters and impacts the sound.
In the next article, I will discuss the solutions I use in the Immersion and Odyssey turntables.